Colon Cancer Cell Classifier — CNN on Tissue Images
The evaluation was the hard part, and getting it right cost me the score.
The app, screen by screen
CLICK TO ENLARGEEvery figure here was written by the project’s own code — matplotlib and seaborn output from the notebook and the experiment scripts, exported unedited. Nothing on this page is a mock-up or a redrawing.
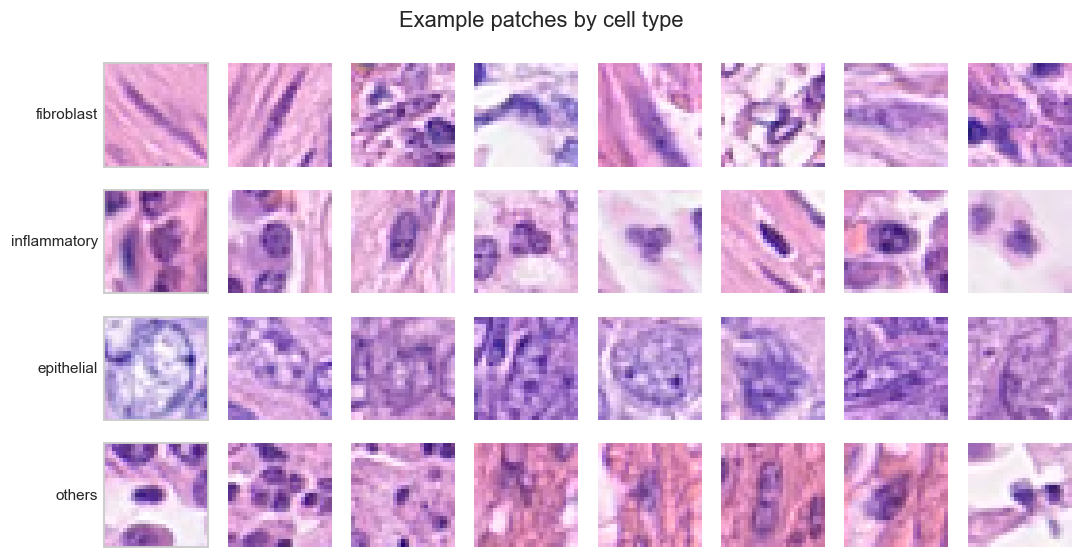
Two classification tasks over 20,280 27×27 patches of H&E-stained colon tissue from 98 patients: is this cell cancerous, and which of four types is it. A CNN against logistic regression, a random forest and an RBF-SVM — all of it split by patient rather than by image, which is the decision the whole project turns on.
How it’s put together
Built with
- PERIOD
- Machine Learning · 2026
- ROLE
- Solo — modelling, evaluation and write-up
The hard parts
08 NOTESEvery split is a patient split, not an image split. Patches from one patient share staining, scanner and morphology, so testing on a patient you trained on measures memory rather than generalisation.
Enforced with StratifiedGroupKFold, and the code asserts the three patient sets are pairwise disjoint — a leak raises rather than passing quietly.
That choice cost the headline. The CNN scores 0.920 macro-F1 on validation and 0.852 on unseen test patients; the SVM falls 0.885 to 0.810. The brief wanted 0.90, so the binary task is recorded as not met. A per-image split would almost certainly have cleared it, by testing on near-identical patches of patients the model had already memorised.
Before modelling, unsupervised analysis to check the problem was real: two principal components explain 25.84% of pixel variance, and K-Means at k=4 recovers the cell types with an Adjusted Rand Index of 0.041 — chance. Raw-pixel similarity is not the axis the labels sit on, which is the argument for learning a representation rather than hand-crafting features.
A structural finding that reframed both tasks: cross-tabulating the labels, isCancerous = 1 exactly when the cell is epithelial, with no exceptions in 9,896 rows. Detecting cancer on this data is operationally detecting epithelial cells — useful for reading the results, and explicitly flagged in the report as an artefact of this dataset rather than a clinical law.
Learning rate swept over five values on the harder task and selected on validation, never test. The response is non-monotonic — 0.690 at 1e-4, 0.760 at 1e-3, a dip to 0.737 at 3e-3, then 0.766 at 1e-2 — so the tuned rate sits where convergence is fast but still stable.
Augmentation closed the overfitting gap on cell-type but lost on test (0.603 against the baseline CNN’s 0.635), and the report says so rather than quoting the better number. Because selection has to happen on validation, where augmentation won, the augmented model is the legitimate pick and the higher score is one I am not entitled to claim.
The failure mode is named rather than averaged away: “others” is a heterogeneous catch-all with 282 test patches, of which 204 are predicted as fibroblast and 39 are right — an F1 of 0.164 that drags the macro-average down on its own. On the binary task, cancerous recall of 0.821 means roughly 18% of cancerous cells are missed, which is the clinically costly direction and is discussed as such.
Want the parts that aren’t on this page — the architecture arguments, the things that broke, a live walkthrough?